[Gretl-users] Fwd: Re: gnuplot: issue plotting monthly data in a panel

Hi Sven,
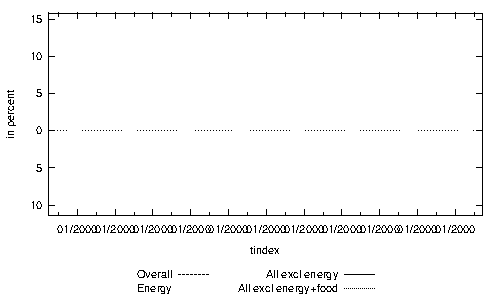
you're right I should be more precisely. You can find the resulting
graph attached -- it is simply empty. Using gretl's internal
"--time-series" option works but for some reason the time-dates
disappear for a restricted panel and the x-axis is just a sequence from
1 to T.
Artur
On 27.02.2015 09:00, Sven Schreiber wrote:
Am 27.02.2015 um 08:24 schrieb Artur T.:
> <hansl>
> smpl country==1 --restricted
> gnuplot x1 x2 tindex --with-lines --single-yaxis --output="@fname" \
> { set term eps font 'Helvetica,13' lw 3 ; \
> set xdata time ; \
> set timefmt "%Y%m" ; set format x "%m/%Y" ; }
> </hansl>
>
> Unfortunately, the x-axis is not correctly shown. The temporary output
> text-file you can find below. Does anybody have a clue what's wrong here?
>
Well, what do you mean by "not correctly shown", what is happening?
-sven
Attachments:
- ts_inflation_DE.png (image/png — 1.2 KB)