[Gretl-users] Graph output

Hi there,
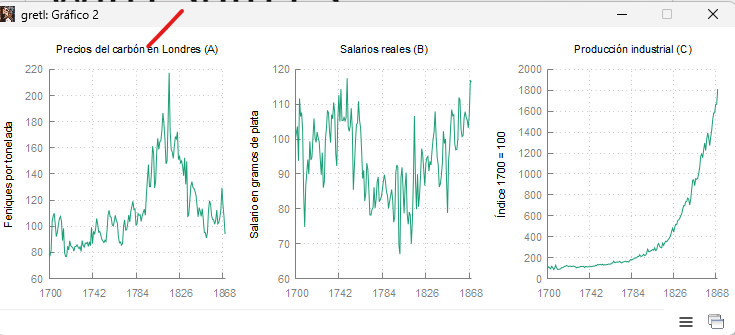
I did some graphs with the new gridplot function (
https://github.com/gretl-project/material-on-gretl/wiki/Plotting#gridplot)
and the visible output is quite nice:
[image: image.png]
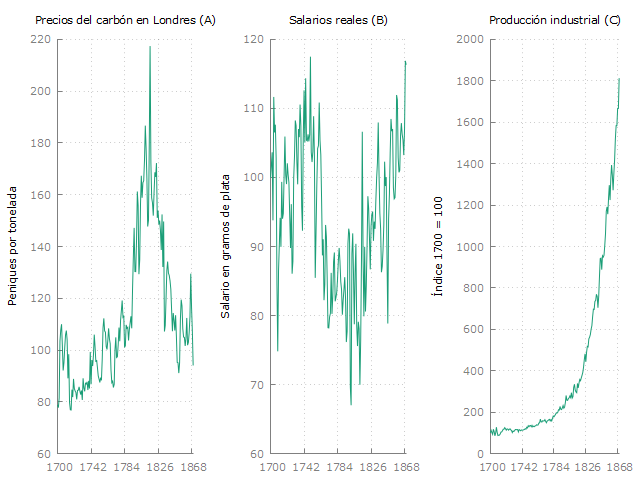
However, when I saved the same image this is the output I got.
[image: TestGraph.png]
I know in pdf the output is customizable, but I needed it in png.
Any tips?
I'm using the latest gretl version and windows 11
--
Atte.
Cristián Arturo Ducoing Ruiz
Attachments:
- attachment.htm (text/html — 1.0 KB)
- image.png (image/png — 45.8 KB)
- TestGraph.png (image/png — 51.6 KB)