[Gretl-users] Plot of residuals from Engle-Granger Cointegration Regression #2

I managed to create a plot of the cointegration regression using the functionality to
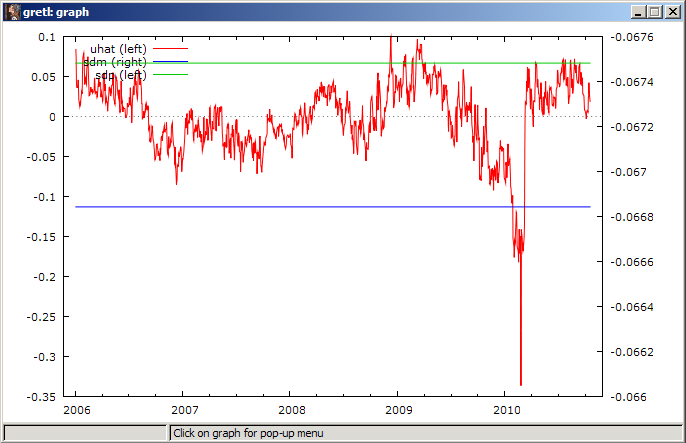
define a new variable which I specify as uhat = parameters of ordinary least squares
regression and then plot those with the 1.5x standard deviation.
See chart below
I do this using console command...
gnuplot uhat sdm sdp --with-lines --time-series
my QUESTION:
how can I change this command to tell gnuplot to create and plot all 3 variables on 1 axis
and have same axis on left and right??
[cid:image001.png@01CA534E.F599EAE0]
Regards,
Michael Grobler
Prescient Securities
Equity Derivatives
Office: +27 (0)21 700 3785
E-mail: michael@prescient.co.za<http://www.psec.co.za/>
Webpage: www.psec.co.za<http://www.psec.co.za/>
________________________________
Disclaimer
This document is confidential and is issued for the information of clients only. It is
subject to copyright and may not be reproduced in whole or in part without the prior
written permission of Prescient Securities (Pty) Ltd (Reg no. 1999/008636/07). Opinions
expressed or recommendations made in this document must be construed as such and while all
attempts have been made to ensure the accuracy of the information herein, Prescient
Securities (Pty) Ltd accepts no liability for decisions taken based on this information.
Attachments:
- attachment.html (text/html — 9.9 KB)
- image001.png (image/png — 38.9 KB)