[Gretl-users] EXTRACTION OF FORECAST DATA FOR USE IN EXCEL

Hi
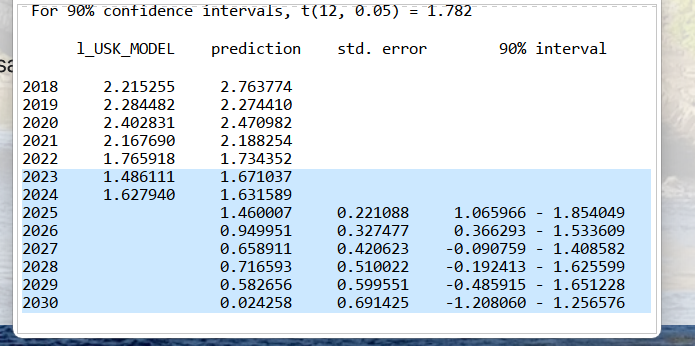
when estimating either with OLS, or Univariate ARmax model specifications
(Gretl 2026b)there is a problem extracting the Further Analysis Forecast
data for download into Excel for improved graphi presentation. Copying the
forecast output produces output which appears as below. Whilst visually
pleasing, unfortunately the columns are not separable for the forecasts
2025-30. No matter how one tries to parse the 2025-2030 block of data, it
remains unseparable via the Excel command process of DATA Text to columns.
That command sequence however works for the actual data and prediction
columns pre forecast ie to 2024, but not thereafter. If one cuts and then
pastes the 2025-2030 block of forecasts and repastes them elsewhere in the
spreadsheet it appears that nothing has actually copied. It would really
help if the output were arranged in a file column format. Quite cleary
the PI range occupies one column.Better to use 2 columns for Lower and
Upper PI range values.
[image: image.png]
Any thoughts on workarounds for the meantime, to avoid having to reinput
the forecasts manually into the Excel spreadsheet.
Brian
*Brian Revell*
Attachments:
- attachment.htm (text/html — 3.9 KB)
- image.png (image/png — 87.2 KB)