
6:03 p.m.
Dear Gretl Team and Yi-Nung,
I find a little problem with the getsymbols function (version 0.1). Taking
a look at line 50 of the function code we can see the following command
(The same command appear at line 6 of the sample script):
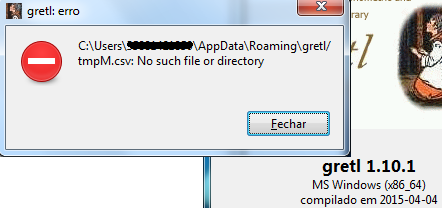
append "(a)dotdir/tmpM.csv"
That's nothing wrong with it when we are using Linux or OSX, but Windows
uses "\" and not "/". So I would like to suggest this fix:
<hansl>
##### Sample script: change line 6 #####
# old:
open "(a)dotdir/tmpM.csv"
# new (suggested):
if $windows
open "(a)dotdir\tmpM.csv"
else
open "(a)dotdir/tmpM.csv"
endif
##### Function code: change line 50 #####
# old:
append "(a)dotdir/tmpM.csv"
# new (suggested):
if $windows
append "(a)dotdir\tmpM.csv"
else
append "(a)dotdir/tmpM.csv"
endif
</hansl>
Also I would like to ask Yi-Nung to provide an e-mail address to the
function description.
Best,
Henrique Andrade

6:42 p.m.
On Thu, 24 Sep 2015, Henrique Andrade wrote:
Dear Gretl Team and Yi-Nung,
I find a little problem with the getsymbols function (version 0.1). Taking
a look at line 50 of the function code we can see the following command
(The same command appear at line 6 of the sample script):
append "(a)dotdir/tmpM.csv"
That's nothing wrong with it when we are using Linux or OSX, but Windows
uses "\" and not "/". So I would like to suggest this fix:
Does the "/" really not work on Windows? I think it ought to; the OS
is supposed to be able to handle forward slashes in filenames.
Allin

7:31 p.m.
On 24 Sep 2015, at 20:42, Allin Cottrell <cottrell(a)wfu.edu>
wrote:
On Thu, 24 Sep 2015, Henrique Andrade wrote:
> Dear Gretl Team and Yi-Nung,
>
> I find a little problem with the getsymbols function (version 0.1). Taking
> a look at line 50 of the function code we can see the following command
> (The same command appear at line 6 of the sample script):
>
> append "(a)dotdir/tmpM.csv"
>
> That's nothing wrong with it when we are using Linux or OSX, but Windows
> uses "\" and not "/". So I would like to suggest this fix:
Does the "/" really not work on Windows? I think it ought to; the OS is
supposed to be able to handle forward slashes in filenames.
In my experience: If “/“ is in a filename and the filename is passed to the windows api it
should work.
Most of the time it won’t work on the command line since / is the Windows equivalent of
the Linux/Unix option character “-“.
One caveat: maybe Microsoft programs don’t accept it.
I would just try it on a Windows machine and see what happens.
Berend
Allin
_______________________________________________
Gretl-devel mailing list
Gretl-devel(a)lists.wfu.edu
http://lists.wfu.edu/mailman/listinfo/gretl-devel
8:30 p.m.
Em 24 de setembro de 2015, Allin escreveu:
On Thu, 24 Sep 2015, Henrique Andrade wrote:
Dear Gretl Team and Yi-Nung,
>
> I find a little problem with the getsymbols function (version 0.1). Taking
> a look at line 50 of the function code we can see the following command
> (The same command appear at line 6 of the sample script):
>
> append "(a)dotdir/tmpM.csv"
>
> That's nothing wrong with it when we are using Linux or OSX, but Windows
> uses "\" and not "/". So I would like to suggest this fix:
>
Does the "/" really not work on Windows? I think it ought to; the OS is
supposed to be able to handle forward slashes in filenames.
I was using a Windows 7 PC with Gretl version 1.10.1 when I got the error
(please take a look at the attached PNG). Using current snapshot everything
works fine.
Best,
Henrique Andrade

1:42 a.m.
Dear all,
I revised getsymbols.gfn as Henrique suggested. And I uploaded the revised
version. Thanks.
I don't have Win 7 so that I am not able to test. Under my winXP "/" or
"\"
both seem to work fine. I often use gretl in PlayonLinux (the wine
environment) under my Ubuntu. Gretl also work great even with
getsymbols.gfn and R installed.
Yi-Nung
2015-09-25 2:42 GMT+08:00 Allin Cottrell <cottrell(a)wfu.edu>:
On Thu, 24 Sep 2015, Henrique Andrade wrote:
Dear Gretl Team and Yi-Nung,
>
> I find a little problem with the getsymbols function (version 0.1). Taking
> a look at line 50 of the function code we can see the following command
> (The same command appear at line 6 of the sample script):
>
> append "(a)dotdir/tmpM.csv"
>
> That's nothing wrong with it when we are using Linux or OSX, but Windows
> uses "\" and not "/". So I would like to suggest this fix:
>
Does the "/" really not work on Windows? I think it ought to; the OS is
supposed to be able to handle forward slashes in filenames.
Allin
_______________________________________________
Gretl-devel mailing list
Gretl-devel(a)lists.wfu.edu
http://lists.wfu.edu/mailman/listinfo/gretl-devel

2:31 p.m.
New subject: OS-dependent behavior of plots
Dear all,
Below is a code to plot irf with confidence bounds
input is n x 3 matrix: 1-st col is irf and the rest are
confidence bounds
It is intended to plot 3 lines:
red solid for irf
and red dashed for bounds
I used Dell 630 latitude
On Ubuntu the plot is as intended to be, but
on the same notebook on XP plot uses
default color/style options: 3 lines are
solid red, blue , green
I know from gnuplot manuals that
dashing is monitor-dependent,
but I used the same pc.
I would be glad to know reports on
the results in other OS's and
suggestions, what it could be:
gretl, gnuplot, monitor, or drivers
< hansl
nulldata 1
function void irf_plot (matrix m "irf or irf + ci bounds",
bool cumul[0] "cumulative or simple(default) irf")
cm = cols(m)
if cm>1
xxx = strsplit(strsub(colname(m,2),"_"," "))
xx = xxx[1]
nr = rows(m)
s1 = seq(0,nr-1)'
m = m~s1
yname = "irf"
xname = "lag"
if cumul
title = "Cumulative irf with "~xx~" bootstrapped confidence
bounds"
else
title = "Irf with "~xx~" bootstrapped confidence bounds"
endif
if nr < 12
plot m
option single-yaxis
options with-lines fit=none
literal set termoption dashed
literal set style line 1 lt 1 lc 1
literal set style line 2 lt 2 lc 1
literal set style line 3 lt 2 lc 1
literal set nokey
literal set xtics 1
printf "set title \"%s\"", title
printf "set xlabel \"%s\"", xname
printf "set ylabel \"%s\"", yname
end plot --output=display
else
plot m
option single-yaxis
options with-lines fit=none
literal set termoption dashed
literal set style line 1 lt 1 lc 1
literal set style line 2 lt 2 lc 1
literal set style line 3 lt 2 lc 1
literal set nokey
printf "set title \"%s\"", title
printf "set xlabel \"%s\"", xname
printf "set ylabel \"%s\"", yname
end plot --output=display
endif
else
nr = rows(m)
s1 = seq(0,nr-1)'
m = m~s1
yname = "irf"
xname = "lag"
if cumul
title = "Cumulative impulse response"
else
title = "Impulse response"
endif
if nr < 12
plot m
options with-lines fit=none
literal set style line 1 lt 1 lc 1
literal set nokey
literal set xtics 1
printf "set title \"%s\"", title
printf "set xlabel \"%s\"", xname
printf "set ylabel \"%s\"", yname
end plot --output=display
else
plot m
options with-lines fit=none
literal set style line 1 lt 1 lc 1
literal set nokey
printf "set title \"%s\"", title
printf "set xlabel \"%s\"", xname
printf "set ylabel \"%s\"", yname
end plot --output=display
endif
endif
end function
irf10= {-0.18227, -0.23235, -0.13178;\
-0.15592, -0.20476, -0.10583;\
-0.058703, -0.079453, -0.035047;\
-0.026099, -0.047385, 0.0015223;\
-0.011117, -0.026593, 0.0054029;\
-0.0047856, -0.016134, 0.0019981;\
-0.0020547, -0.0096853, 0.00033121;\
-0.00088274, -0.0059829, 2.9214e-005;\
-0.00037919, -0.0036523, 6.2045e-006;\
-0.00016289, -0.0022186, 3.1268e-006;\
-6.9971e-005, -0.0013321, 1.5574e-006}
colnames(irf10,"irf 90%_lb 90%_rb")
irf_plot(irf10)
hansl>
Oleh

2:41 p.m.
New subject: OS-dependent behavior of plots
On Fri, 25 Sep 2015, oleg_komashko(a)ukr.net wrote:
Dear all,
Below is a code to plot irf with confidence bounds
[...]
It is intended to plot 3 lines: red solid for irf and red dashed for
bounds
I used Dell 630 latitude
On Ubuntu the plot is as intended to be, but on the same notebook on XP
plot uses default color/style options: 3 lines are solid red, blue ,
green
I _suspect_ it isn't an OS dependent thing, if not indirectly: I think the
syntax for linestyles changed between gnuplot 4.x and 5.x; is it possioble
that you have one version on Win and another on linux?
-------------------------------------------------------
Riccardo (Jack) Lucchetti
Dipartimento di Scienze Economiche e Sociali (DiSES)
Università Politecnica delle Marche
(formerly known as Università di Ancona)
r.lucchetti(a)univpm.it
http://www2.econ.univpm.it/servizi/hpp/lucchetti
-------------------------------------------------------
3:20 p.m.
New subject: OS-dependent behavior of plots
On Fri, 25 Sep 2015, Riccardo (Jack) Lucchetti wrote:
On Fri, 25 Sep 2015, oleg_komashko(a)ukr.net wrote:
> Dear all,
> Below is a code to plot irf with confidence bounds
[...]
> It is intended to plot 3 lines: red solid for irf and red dashed for bounds
>
> I used Dell 630 latitude
>
> On Ubuntu the plot is as intended to be, but on the same notebook
> on XP plot uses default color/style options: 3 lines are solid red,
> blue , green
I _suspect_ it isn't an OS dependent thing, if not indirectly: I
think the syntax for linestyles changed between gnuplot 4.x and 5.x;
is it possioble that you have one version on Win and another on
linux?
Yes, Ubuntu has an older version of gnuplot while the gretl package
for Windows has the current version. The incompatibility is
unfortunate, but here's how to modify the spec in Oleh's script,
under the gretl "plot" command:
<gnuplot-4>
literal set termoption dashed
literal set style line 1 lt 1 lc 1
literal set style line 2 lt 2 lc 1
literal set style line 3 lt 2 lc 1
</gnuplot-4>
<gnuplot-5>
literal set linetype 1 lc 1
literal set linetype 2 lc 1 dt 2
literal set linetype 3 lc 1 dt 2
</gnuplot-5>
where "dt" is an abbreviation for "dashtype".
Allin
7:51 p.m.
New subject: OS-dependent behavior of plots: thanks and a proposal
Dear Allin,
First, thanks: it works
Second,
I submitted a package with this function, but
I am not sure it would be approved, since
it is partly redundant
But anyway I give it for my students,
so it must be OS-independent
For now, i could use $windows,
but I can't predict when, say Ubuntu
will change to 5.x, or if
someone prefer to compile the last
gnuplot (me, for example compile last
gretl, have last R and the rest from
Ubuntu repos, with some exceptions
as calibre)
So it would be convenient if gretl
have something outputting gnuplot
version
Oleh
25 вересня 2015, 18:20:49, від "Allin Cottrell" <cottrell(a)wfu.edu>:
On Fri, 25 Sep 2015, Riccardo (Jack) Lucchetti wrote:
> On Fri, 25 Sep 2015, oleg_komashko(a)ukr.net wrote:
>
>> Dear all,
>> Below is a code to plot irf with confidence bounds
> [...]
>
>> It is intended to plot 3 lines: red solid for irf and red dashed for bounds
>>
>> I used Dell 630 latitude
>>
>> On Ubuntu the plot is as intended to be, but on the same notebook
>> on XP plot uses default color/style options: 3 lines are solid red,
>> blue , green
>
> I _suspect_ it isn't an OS dependent thing, if not indirectly: I
> think the syntax for linestyles changed between gnuplot 4.x and 5.x;
> is it possioble that you have one version on Win and another on
> linux?
Yes, Ubuntu has an older version of gnuplot while the gretl package
for Windows has the current version. The incompatibility is
unfortunate, but here's how to modify the spec in Oleh's script,
under the gretl "plot" command:
literal set termoption dashed
literal set style line 1 lt 1 lc 1
literal set style line 2 lt 2 lc 1
literal set style line 3 lt 2 lc 1
literal set linetype 1 lc 1
literal set linetype 2 lc 1 dt 2
literal set linetype 3 lc 1 dt 2
where "dt" is an abbreviation for "dashtype".
Allin
_______________________________________________
Gretl-devel mailing list
Gretl-devel(a)lists.wfu.edu
http://lists.wfu.edu/mailman/listinfo/gretl-devel
8:10 p.m.
New subject: OS-dependent behavior of plots: thanks and a proposal
On Fri, 25 Sep 2015, oleg_komashko(a)ukr.net wrote:
So it would be convenient if gretl
have something outputting gnuplot
version
Maybe this can help
<hansl>
function scalar gnuplot_version(void)
string tmpfile = "(a)dotdir/gpv.txt"
!gnuplot --version > @tmpfile
string s = readfile(tmpfile)
scalar ret
sscanf(s, "gnuplot %g", ret)
return ret
end function
a = gnuplot_version()
print a
</hansl>
Moreover, debian has a package called "gnuplot5". I don't know if ubuntu
users can grab that, or if it's been incorporated into ubuntu already.
-------------------------------------------------------
Riccardo (Jack) Lucchetti
Dipartimento di Scienze Economiche e Sociali (DiSES)
Università Politecnica delle Marche
(formerly known as Università di Ancona)
r.lucchetti(a)univpm.it
http://www2.econ.univpm.it/servizi/hpp/lucchetti
-------------------------------------------------------
8:23 p.m.
New subject: OS-dependent behavior of plots: thanks to Riccardo
Dear Riccardo,
Thank you,
I will include it
The matter is as follows:
I used Debian for more than a year using option
"without a root user"
But they changed something in security policy:
I had to use kdesudo synaptic instead of synaptic!
Another thing: drivers for Dell 630:
the pc began to crash with KDE5 occasionally
first I switched to Kubuntu, since I used
Debian with KDE
But KDE development team seems to have didn't
make enough drivers for my Dell while transiting to KDE5,
as a result I switched to standard Ubuntu 15.04 and
still everything is ok: I used to some features of
Dolphin, and it seems doesn't conflicts with
native gnome nautilus
Oleh
25 вересня 2015, 23:10:36, від "Riccardo (Jack) Lucchetti"
<r.lucchetti(a)univpm.it>:
On Fri, 25 Sep 2015, oleg_komashko(a)ukr.net wrote:
> So it would be convenient if gretl
> have something outputting gnuplot
> version
Maybe this can help
function scalar gnuplot_version(void)
string tmpfile = "(a)dotdir/gpv.txt"
!gnuplot --version > @tmpfile
string s = readfile(tmpfile)
scalar ret
sscanf(s, "gnuplot %g", ret)
return ret
end function
a = gnuplot_version()
print a
Moreover, debian has a package called "gnuplot5". I don't know if ubuntu
users can grab that, or if it's been incorporated into ubuntu already.
-------------------------------------------------------
Riccardo (Jack) Lucchetti
Dipartimento di Scienze Economiche e Sociali (DiSES)
Università Politecnica delle Marche
(formerly known as Università di Ancona)
r.lucchetti(a)univpm.it
http://www2.econ.univpm.it/servizi/hpp/lucchetti
-------------------------------------------------------
9 p.m.
New subject: OS-dependent behavior of plots: thanks and a proposal
25 вересня 2015, 23:10:36, від "Riccardo (Jack) Lucchetti"
<r.lucchetti(a)univpm.it>:
On Fri, 25 Sep 2015, oleg_komashko(a)ukr.net wrote:
> So it would be convenient if gretl
> have something outputting gnuplot
> version
Maybe this can help
function scalar gnuplot_version(void)
string tmpfile = "(a)dotdir/gpv.txt"
!gnuplot --version > @tmpfile
string s = readfile(tmpfile)
scalar ret
sscanf(s, "gnuplot %g", ret)
return ret
end function
a = gnuplot_version()
print a
Moreover, debian has a package called "gnuplot5". I don't know if ubuntu
users can grab that, or if it's been incorporated into ubuntu already.
-------------------------------------------------------
Riccardo (Jack) Lucchetti
Dipartimento di Scienze Economiche e Sociali (DiSES)
Università Politecnica delle Marche
(formerly known as Università di Ancona)
r.lucchetti(a)univpm.it
http://www2.econ.univpm.it/servizi/hpp/lucchetti
-------------------------------------------------------
9:15 p.m.
New subject: OS-dependent behavior of plots: sell is switched off by default
Dear Riccardo:
As your script works
with shell switched on with
switch off as default
I simply include int gnuplotversion [4::5]
and instructions and your function
as a public
Oleh
25 вересня 2015, 23:10:36, від "Riccardo (Jack) Lucchetti"
<r.lucchetti(a)univpm.it>:
On Fri, 25 Sep 2015, oleg_komashko(a)ukr.net wrote:
> So it would be convenient if gretl
> have something outputting gnuplot
> version
Maybe this can help
function scalar gnuplot_version(void)
string tmpfile = "(a)dotdir/gpv.txt"
!gnuplot --version > @tmpfile
string s = readfile(tmpfile)
scalar ret
sscanf(s, "gnuplot %g", ret)
return ret
end function
a = gnuplot_version()
print a
Moreover, debian has a package called "gnuplot5". I don't know if ubuntu
users can grab that, or if it's been incorporated into ubuntu already.
-------------------------------------------------------
Riccardo (Jack) Lucchetti
Dipartimento di Scienze Economiche e Sociali (DiSES)
Università Politecnica delle Marche
(formerly known as Università di Ancona)
r.lucchetti(a)univpm.it
http://www2.econ.univpm.it/servizi/hpp/lucchetti
-------------------------------------------------------
3853
days inactive
3854
days old
12 comments
6 participants
participants (6)
-
 Allin Cottrell
 -
 Berend Hasselman
 -
 Henrique Andrade
 -
 oleg_komashko@ukr.net
 -
 Riccardo (Jack) Lucchetti
 -
 yinung@Gmail